
Warehousing, terminals and allocationEnergy and charging
LNG import terminal: when ships unload, so the tank never runs over or empty
When may which ship unload, so the tank never runs over or empty and the gas keeps flowing?
LNG import terminals and FSRU operatorsGas network and storage operatorsEnergy traders with terminal capacityPorts with liquid bulk terminals
Drag to rotate, right-drag or shift-drag to move the map, scroll or pinch to zoom. The gauge shows the tank of the FSRU with its band (red lines at 10 % and 95 %); it turns amber close to a limit and red outside. A ship that may not unload yet waits at the anchorage with an amber chip. On top of the schedule: the tank, the gas sent to the grid, the tide windows (blue) and the storm (red), the news and the re-plans (purple); then each carrier (dashed: at anchor, blue: pumping at its rate) and the truck bays. Switch to first come, first served to compare; hover a bar for details.
The planning question
This LNG import terminal is a floating storage and regasification unit (FSRU): a ship moored at a jetty that stores liquefied natural gas (LNG) and turns it back into gas for the grid. Its tank holds 170,000 m³. LNG carriers moor alongside and pump their cargo across, about 150,000 m³ in a little more than a day. Road trucks load LNG at three bays on shore, and the grid takes gas every hour, more in the morning and in the evening.
The tank is the bottleneck. A ship can only unload when there is room, and the tank must never fall below its minimum (the heel, a rest of LNG that keeps the tank cold) or the gas for the grid runs out. Ships may only berth around high water and not in a storm. A ship that stays longer than its agreed laytime costs demurrage, here €75,000 a day.
The simulated week brings news: on Monday night Carrier A reports a delay of 14 and a half hours from head wind, on Tuesday the weather service forecasts a cold spell with more gas demand, on Wednesday a storm is forecast that closes the berth from Friday 09:00 to Saturday 11:00, and on Thursday morning a truck bay fails for five hours.
How we plan it
The model plans every carrier call and every truck loading of the week: berth time, pump rate and bay. A tank check at the end of every hour adds what the ships pump in and subtracts the trucks and the gas the grid is expected to take. The band, the tide, the storm and one ship at the berth are hard rules; then trucks in their booked slot; then euros for demurrage, for slow pumping and for changes against the last plan.
The week is simulated twice with the same events: ships keep their true arrival times, the gas demand follows the grid, trucks come a little early or late. Whenever news comes in, the model plans again from the current state within 15 seconds. A ship at the berth keeps its berth time but may change its rate; a ship less than a day away keeps its arrival. The comparison is common practice: first come, first served at full rate, a ship waits at anchor until the tank has room for its whole cargo, and trucks are held while the tank is below its band.
What the plan shows
| KPI | Optimized plan | Comparison: First come, first served |
|---|---|---|
| hours outside the band | 0 h −7.4 | 7.4 h |
| demurrage | 66,667 € −151,823 | 218,490 € |
| ship hours at anchor | 20.8 h −56.8 | 77.6 h |
| trucks on time | 94.9 % +2.2 | 92.7 % |
Decisions
- when each carrier berths, and when it is asked to arrive, so that it sails slower and waits less at anchor
- how fast each carrier pumps: 50, 75 or 100 % of 6,000 m³ per hour
- bay and loading time of every truck; everything again whenever news comes in
Constraints
- one ship at the berth, berthing only within two hours of high water and not in a storm
- the tank between 10 % and 95 % at the end of every hour
- trucks load in their booked slot
Objective
the tank inside its band, then trucks on time, then little demurrage and a calm plan
Questions
Is the terminal real?
No. The terminal, the ships, the trucks and the week are fictional. Sizes, rates and times are assumptions within published ranges: 170,000 m³ of storage on the FSRU, ship to ship transfer at 6,000 m³ per hour, 4 hours to moor and connect, 36 hours of laytime, trucks of 40 to 56 m³ at 50 m³ per hour. The band of 10 % to 95 % is an assumption as well; real limits are set terminal by terminal.
What does the plan do differently in this week?
Two things. On Monday it asks Carrier B to arrive at the end of its unloading window, Thursday 12:00, because the tank will still be well filled from Carrier A. The ship sails slower, and its laytime starts later. When the cold spell is forecast on Tuesday, the model sees that the tank will empty faster and plans Carrier B for Friday 06:00, before the storm, pumping at 75 % so that the tank never runs over. The ship pumps through the storm and leaves on Saturday evening. First come, first served lets Carrier B wait at anchor from Wednesday 14:00 until there is room for its whole cargo at full rate. By then the storm has closed the berth. The ship berths on Saturday at 16:55, and the tank falls to about 9,500 m³, 6 %.
Why does a slower pump rate help?
The grid takes about 1,300 m³ of LNG every hour, so the room in the tank grows all the time. At full rate a ship fills the tank much faster than the grid empties it, so it may only start when there is room for almost the whole cargo. At 75 % it can start earlier and still never overfill the tank. It stays longer at the berth, which the model weighs against the waiting.
What is demurrage?
The charter of a ship allows a time at the terminal, the laytime, here 36 hours from arrival. Every hour beyond costs demurrage, here €75,000 a day. A ship that waits at anchor for room in the tank uses up its laytime. In this week the comparison pays about €218,000, the plan about €67,000.
What about the trucks?
Trucks book a slot. When truck bay 2 fails on Thursday morning, the model moves the waiting trucks to the other bays and times. First come, first served also holds the trucks on Saturday while the tank is below its band. In the plan 94.9 % of the trucks load on time, in the comparison 92.7 %.
What data does it need?
The delivery programme with the unloading windows, the ship reports (arrival time, cargo), the nomination of the grid, the truck bookings, tide tables, weather forecasts and the current tank level. Most of it is in the scheduling system of the terminal and in the nomination process.
What would a pilot look like?
A few months of ship calls, nominations and truck loadings calibrate the simulation. Then the plan runs next to the current scheduling, re-planned with every new report, and both are compared on the same weeks before it is used.
More use cases
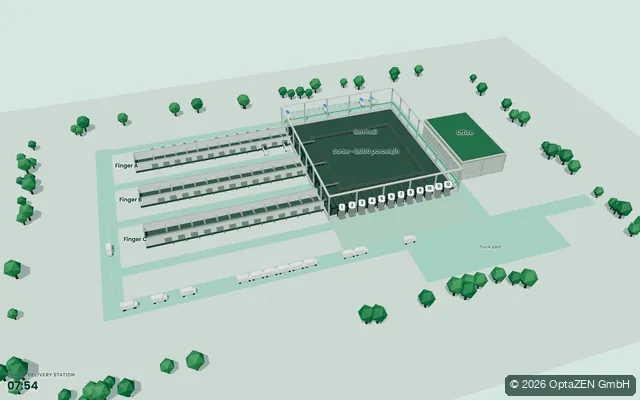 06:45
Parcel hub · dock scheduling
Overnight trucks, 12 doors, a sorter for 6,000 parcels per hour and 78 van bays. The morning delivery wave has to leave on time.
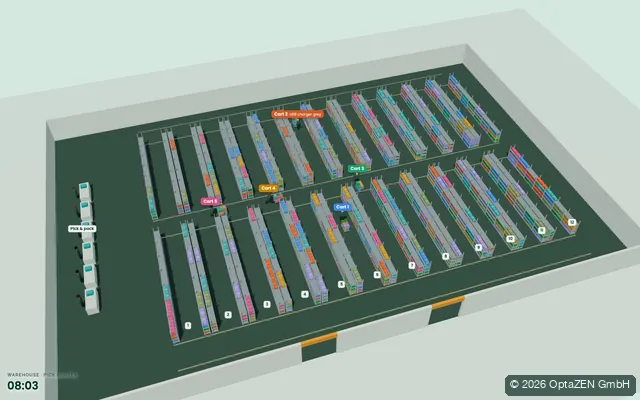 11:40
Warehouse · order batching & pick routes
Twelve aisles, 900 articles in chaotic storage, trolleys with several order buckets: shorter walks and faster waves.
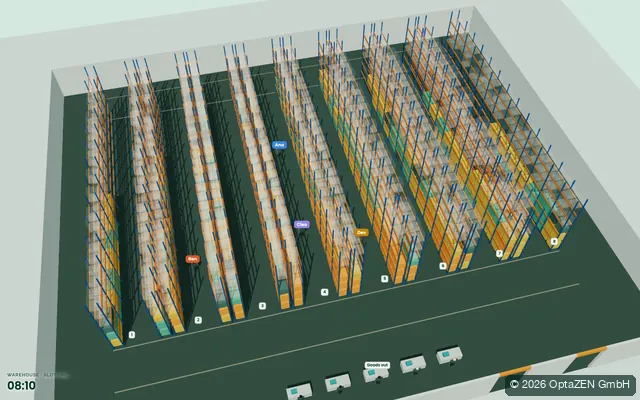 Weeks
Warehouse · slotting
400 articles, 624 pick slots on three levels: fast movers near goods out, heavy goods low, the ergonomic level for high volume.
The first step
Where does your planning lose time, capacity or money?
In a free first call we work out which next step is really worth it.