
Tankers by quantity: which ship brings how much where, so no tank farm runs dry
Which ship brings how much where, so no tank farm runs dry, with little empty sailing?
Oil and fuel distributorsChemical companies that supply sites by seaShort-sea tanker operatorsEnergy traders with tank farm capacity
Drag to rotate, right-drag or shift-drag to move the map, scroll or pinch to zoom. Every tank farm has a chip per grade (brown diesel, blue gasoline) with its stock and the days left until its minimum; it turns amber when it gets close and red below the minimum. Tankers carry a cargo bar in the colour of their grade; laden voyages are drawn solid, empty voyages dashed grey. On top of the schedule: the stock of every tank farm with its band (dashed lines), then the news and the re-plans (purple), each tanker (arrows: sailing with its speed, blocks: in port) and the refineries. Switch to the reorder point to compare; hover a bar for details.
The planning question
Two refinery terminals in the north produce diesel and gasoline every day. Five tank farms around a fictional inland sea, one of them on an island, sell it to their region every day. Each tank farm has a minimum (a reserve of a few days) and a maximum (the size of its tanks), and the refineries must be lifted before their tanks are full. Four product tankers of 6,000 to 20,000 m³ carry the product. A tanker carries one grade at a time and cleans its tanks for 18 hours before it loads the other grade; the largest one does not fit into three of the ports.
Planning by quantity means: the planner decides which tanker calls where and in which order, how much it loads or discharges at each call and how fast it sails each leg. Slower saves a lot of fuel and CO₂: at 10 knots a tanker burns about 30 % less fuel per mile than at 12 knots. Faster keeps a tight tank farm supplied. Sailing empty costs the same and carries nothing.
The three weeks bring news: the sales of the tank farms vary from day to day, a cold spell raises the demand for diesel and heating oil in the west and the centre by 35 % for six days, a storm in the east slows the ships and closes tank farms D and E for berthing for 36 hours, and one berth is taken by another ship for 20 hours.
How we plan it
The model plans the list of port calls of every tanker and, for each call, the quantity and the speed into the port. From the state of a tanker (where it is, when it is free, what it carries) the voyage follows call by call: sea miles, sailing time at the chosen speed, tank cleaning before a grade change, berthing, pumping, leaving. The stock of every tank farm and refinery is checked day by day. A day outside the band is a hard rule, and so are ship size, capacity, one grade per voyage and one ship per berth. Then euros: fuel at €0.70 per kg, CO₂ under the EU emissions trading system (3.2 kg per kg of fuel at €73 per tonne), charter per day while a tanker is in use, and port fees. Every tank farm should be back at its start level after the three weeks, so that a plan cannot look cheap by emptying the tanks.
The weeks are simulated twice with the same events. The model plans at the start, again every three days and whenever news comes in, each time from the current state: a tanker at sea keeps its next port, one in port finishes its call. The comparison is common practice, a reorder point: when a tank farm, counting what is on the way, falls below its minimum plus five days of sales, the next free tanker loads as much as fits at the nearest refinery, sails at 14 knots, discharges everything and returns empty to that refinery.
What the plan shows
| KPI | Optimized plan | Comparison: Reorder point |
|---|---|---|
| tank-farm days below the minimum | 0 −5 | 5 |
| empty sailing (share of miles) | 36.9 % −14.9 | 51.8 % |
| cost per m³ incl. CO₂ | 13.3 € −2 | 15.31 € |
| CO₂ per m³ | 11 kg −3.5 | 14.5 kg |
Decisions
- the voyage of every tanker: which refinery and tank farms it calls at, in which order
- how much it loads or discharges at each call: a quarter, half, three quarters or all of its tanks
- how fast it sails each leg, 10 to 14 knots; everything again every three days and after news
Constraints
- every tank farm between its minimum and maximum on every day, and no refinery tank overflowing
- the ship fits the port, carries one grade at a time and never more than it holds
- one ship at each berth; pumping rate and port time set the stay
Objective
no tank farm below its minimum, then a low cost per m³: fuel and CO₂, charter, port fees, little empty sailing
Questions
Are the ports and ships real?
No. The sea, the ports, the companies and the tankers are fictional. Sizes, rates and costs are assumptions within published ranges: product tankers of 6,000 to 20,000 m³, 10 to 14 knots, fuel per hour growing with the cube of the speed, marine gas oil at €0.70 per kg, CO₂ at €73 per tonne, 8 to 12 hours in port. Distances are measured on the chart, not along real sea routes.
Where does the saving come from?
Mostly from speed and from fewer empty miles. The plan sails laden at about 10 knots on average, because it delivers before a tank farm gets low; the reorder point sails at 14 knots because it only reacts when a tank farm is already low. The plan also combines calls: a tanker discharges part of its cargo at one tank farm and the rest at the next, and loads at the refinery closest to its next delivery. Of 11,694 sea miles 37 % are sailed empty, against 52 % of 10,026 miles with the reorder point. Fuel falls from 495 to 391 tonnes, CO₂ from 1,588 to 1,252 tonnes.
Why does the reorder point let tank farms fall below their minimum?
It waits until a tank farm is low and then sends the next free tanker. When the cold spell raises the demand, several tank farms reach their reorder point at the same time, the free tankers are far away, and Refinery East has been emptied by full loads for single tank farms. Tank farms A and B run short of diesel and D of gasoline, on five tank farm days in total. The model plans all tank farms together, three weeks ahead, and has the cold spell in its forecast about two days before it starts.
Does the plan need all four tankers all the time?
No. The largest tanker, 20,000 m³, is in use for 276 of the 504 hours; after its last call it is free for other work. With the reorder point the four tankers are in use for 453 to 504 hours. Charter falls from about €1,012,000 to about €860,000.
How is the cost per m³ calculated?
Fuel and CO₂, charter for the hours a tanker is in use, and port fees, divided by the m³ delivered to the tank farms. The plan delivers 113,500 m³ and ends the three weeks with 65,221 m³ in the tank farms (65,500 at the start). The reorder point delivers 109,131 m³ and ends with 60,852 m³. The plan costs €13.30 per m³, the reorder point €15.31.
What data does it need?
Stocks with minimum and maximum per tank farm and grade, the sales forecast, the production plan of the refineries, the fleet with sizes, speeds, fuel curves and charter terms, port restrictions and pumping rates, weather forecasts and the positions of the ships (AIS).
What would a pilot look like?
A few months of stocks, sales and voyages calibrate the forecast and the simulation. Then the plan runs next to the current dispatching, re-planned every few days, and both are compared on the same weeks before it is used.
More use cases
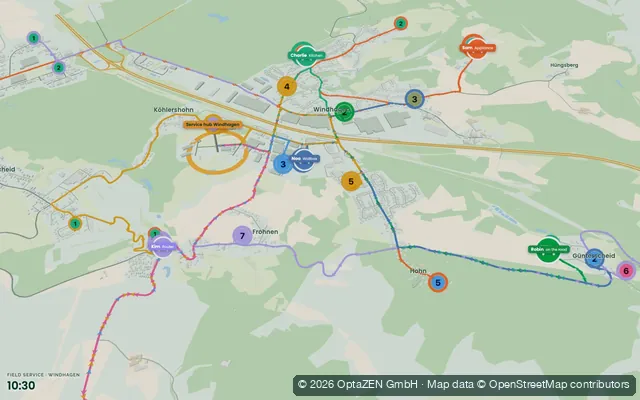 07:00
Field service routing
Eight technicians, 29 home installations, arrival windows and skills, planned on the real roads around Windhagen.
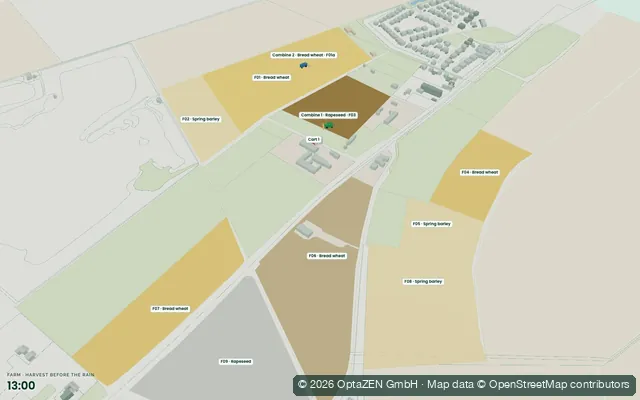 15:00
Agriculture · harvest before the rain
Two combines from 10:00, rain from 16:00, two grain carts to the silo. The goal is the most crop value harvested before the weather turns.
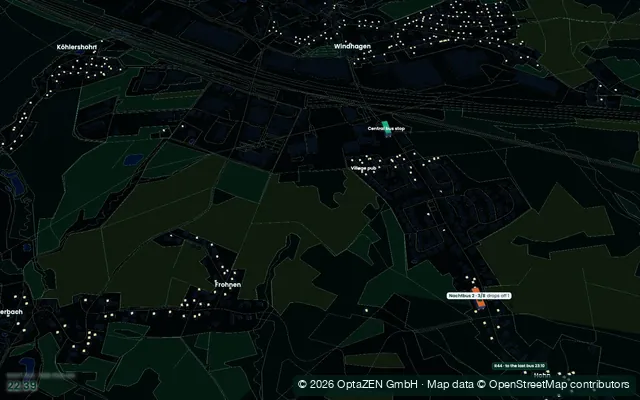 01:00
Night bus · ride pooling
Bookings from the last trains, the village pub and between villages. Three minibuses pool the rides home on real roads.
The first step
Where does your planning lose time, capacity or money?
In a free first call we work out which next step is really worth it.