
Fleet mix for a courier: electric or diesel, battery size and chargers
Which vehicles, battery sizes and depot chargers should a regional courier run for a whole year, and which vehicle drives which tour and direct run each day, so that the year costs least at the existing grid connection?
Result in this example, compared with “Today's fleet”: electric km 97 % instead of 0 %, CO₂ per year 53 t instead of 156 t, cost per year 600 k€ instead of 775 k€.
Courier and express servicesParcel and general cargo carriersWholesale with own deliveryService fleetsFleet managers and leasing companies
Drag to rotate, right-drag or shift-drag to move the map, scroll or pinch to zoom. The depot is drawn enlarged; a charger lights up in the colour of the vehicle that charges there. Stops turn from grey to the colour of the vehicle that delivered them, and vehicles on a direct run leave the map at the motorway. On top of the schedule: depot load, grid import and the depot battery. Hover a vehicle, charger or bar for details, and switch between the future and today’s fleet above the map.
The planning question
A fictional courier with a depot near Windhagen in the Westerwald delivers 400 to 700 stops a day. The stops are grouped into about 30 tour blocks, each one small van full, in an early wave from 07:00 and a midday wave from 13:15. On top come up to five direct runs a day: urgent shipments to receivers 75 to 225 km away, with a time window at the receiver. Volumes peak before Christmas and dip in the summer holidays, and in frost an electric van needs a third more energy than at 20 °C. Today the courier runs 18 diesel vans of two sizes and 2 diesel cars, and every van drives its usual blocks. The depot has a grid connection of 200 kVA and a battery storage of 200 kWh; both stay as they are. The choice is between small and large electric vans with different batteries (a larger battery lowers the payload), an electric van of 4.25 t that may be driven with a car licence, diesel vans, an electric or a diesel car, and AC and DC chargers.
How we plan it
The year is simulated day by day, Monday to Saturday, with volumes, direct runs and temperatures, and condensed into 12 typical days with their weight and 3 hard days: the busiest day in December (the Tuesday shown), the coldest day and the day with the most direct runs. The planning has two levels. The first decides the fleet and the chargers. It scores every candidate fleet by dispatching all typical and hard days with a fast set of rules and adding up the year, starting from today’s fleet. A day of the year on which a candidate cannot serve every tour becomes a further hard day.
The second level plans each of these days in full for the best candidates: which vehicle drives which block and run, which neighbouring blocks a large van merges, and how the depot charges. Charging is followed in steps of 15 minutes: a returning driver plugs in, the depot staff re-plug vehicles in the evening and early morning, the night charge is spread out, and the depot battery keeps the load flat. On a direct run an electric vehicle charges at a public fast charger, if possible during the driver’s break. The cheapest fleet after this daily plan is the future fleet. It then runs through all 306 working days of the year with the fast rules, to count rental days and to check that every tour is served. The two levels are not one joint optimum: the fleet is chosen with the simpler dispatch.
What the plan shows
| KPI | Optimized plan | Comparison: Today's fleet |
|---|---|---|
| cost per year | 600 k€ −175 | 775 k€ |
| CO₂ per year | 53 t −103 | 156 t |
| electric km | 97 % +97 | 0 % |
| peak depot load | 55 kW +34 | 21 kW |
| rental days per year | 81 −2 | 83 |
Decisions
- number of vehicles per type and battery: small e-van with 50, 70 or 85 kWh, large e-van with 56 or 81 kWh, 4.25 t e-van with 113 kWh, small or large diesel van, e-car, diesel car
- number of AC chargers (11 or 22 kW) and DC chargers (50 or 150 kW) in the depot
- per day: which two neighbouring tour blocks a large van drives as one tour
- per day: the vehicle for every tour and direct run, or a rental van
- per day: charging in the depot (charger, order, power, re-plugging by the staff), the depot battery, fast charging on direct runs
Constraints
- every tour and direct run is driven, by an own vehicle or a rental van (at most four a day)
- payload and load space of every tour; a merged tour carries both blocks
- battery never below a 10 % reserve and planned at 88 % of its capacity for ageing; consumption follows the temperature of the day
- one vehicle per charger; grid import within the 200 kVA connection together with the depot battery; every vehicle charged again by 06:00
- tours back within their wave, receivers reached in their time window, working time of the drivers with a break on long runs
Objective
the lowest cost per year: vehicles (price, residual value, maintenance, insurance, tax, minus the greenhouse gas quota), chargers, depot electricity including the highest 15 minutes of the year, diesel, fast charging on the road, rental vans and the drivers’ time on the road and at the depot; CO₂ as a second figure
What the year costs
Costs per year in thousand euros, net, for the 306 working days of the simulated year.
| Cost item | Today’s fleet | Future fleet |
|---|---|---|
| Vehicles: purchase spread over 7 years, less residual value, plus insurance and tax, less the greenhouse gas quota | 158 | 104 |
| Chargers and load management | 0 | 13 |
| Diesel | 76 | 2 |
| Depot electricity, hall included, with the demand charge | 34 | 63 |
| Fast charging on the road | 0 | 2 |
| Rental vans | 11 | 4 |
| Maintenance, repair and tyres | 35 | 25 |
| Driver time on the road and at the depot (30 euros per hour) | 461 | 388 |
| Total | 775 | 600 |
Rounded; the totals are added from the exact values. Driver time at the stops is the same in every plan and not counted. The grid connection and the depot battery are given and count in neither fleet. The rental vans in this table come from the weighted typical days; the 81 and 83 rental days in the questions below come from the run through all 306 days.
Vehicle costs per type
Every vehicle is counted per year: the list price less a fleet discount of 10 %, less the residual value after 7 years (12 % of the list price for electric, 18 % for diesel, discounted), spread over 7 years at 6 % interest, plus insurance and tax, less the greenhouse gas quota. Maintenance is counted per kilometre.
| Type | List price, net | Per year, after quota | Quota per year | Maintenance per km | Today | Future |
|---|---|---|---|---|---|---|
| Small diesel van | 40,500 € | 7,346 € | 6 ct | 12 | 0 | |
| Small e-van, 50 kWh | 47,500 € | 7,829 € | 800 € | 4.5 ct | 0 | 2 |
| Small e-van, 70 kWh | 51,500 € | 8,417 € | 800 € | 4.5 ct | 0 | 0 |
| Small e-van, 85 kWh | 56,500 € | 9,151 € | 800 € | 4.5 ct | 0 | 1 |
| Large diesel van | 54,400 € | 9,715 € | 8 ct | 6 | 0 | |
| Large e-van, 56 kWh | 50,000 € | 8,636 € | 800 € | 6 ct | 0 | 1 |
| Large e-van, 81 kWh | 57,600 € | 9,753 € | 800 € | 6 ct | 0 | 0 |
| E-van 4.25 t, 113 kWh | 63,550 € | 7,427 € | 4,000 € | 6 ct | 0 | 7 |
| Diesel car | 33,000 € | 5,763 € | 4 ct | 2 | 1 | |
| E-car, 77 kWh | 39,400 € | 6,407 € | 372 € | 3 ct | 0 | 2 |
Without the quota the 4.25 t e-van would cost 11,427 euros a year, more than any other van; see the question on the greenhouse gas quota below.
Chargers in the depot
Chargers are bought once, installed, and spread over their life at 6 % interest; maintenance of 2 % (AC) or 4 % (DC) of the price a year is added.
| Charger | Price, installed | Life | Per year | Future fleet |
|---|---|---|---|---|
| AC 11 kW | 2,500 € | 8 years | 453 € | 13 |
| AC 22 kW | 3,500 € | 8 years | 634 € | 0 |
| DC 50 kW | 30,000 € | 10 years | 5,276 € | 1 |
| DC 150 kW | 70,000 € | 10 years | 12,311 € | 0 |
| Load management | 5,000 € plus 1,200 € a year | 8 years | 2,005 € | 1 |
| Future fleet in all | 67,500 € | 13,165 € |
2,500 euros per AC charger is at the low end. With long cables or digging in the yard it costs more; at 4,500 euros per charger the year would cost about 4,000 euros more. Subsidies are not deducted. The depot battery of 200 kWh is already there; bought new it would cost about 80,000 to 90,000 euros.
Questions
What does assigning the tours anew bring, compared with replacing each van one to one?
The usual analysis replaces each van by an electric van if its 95 % day in winter fits the battery, with one AC charger per e-van and the same tours as today. Here that gives 16 e-vans, 2 diesel vans and 2 diesel cars and saves about 19,000 euros a year (756 instead of 775 thousand) and half of the CO₂. Assigning the tours anew every day with today’s diesel fleet saves about 94,000 euros, mostly because large vans drive two neighbouring blocks in one tour: no drive back to the depot in between, one loading instead of two, about 2,400 driver hours less a year. The future fleet combines both and needs 11 vans and 3 cars instead of 18 and 2.
From which diesel or electricity price does the mix tip?
Compared with the same fleet in diesel, the electric fleet stays cheaper down to a diesel price of about 0.63 euros per litre, or up to a depot electricity price of about 0.52 euros per kWh, all other prices as assumed (diesel 1.60 euros per litre, electricity 0.22 euros per kWh, both net). Choosing the mix again at other prices changes single vehicles: at 1.35 euros per litre three small diesel vans come back and about 79 % of the kilometres are electric, at 2.00 euros about 90 %. Electricity at 0.19 euros per kWh lowers the cost of the year by about 9,000 euros, at 0.27 euros it raises it by about 15,000 euros; the mix stays mostly electric.
How much depends on the greenhouse gas quota?
A lot for the 4.25 t vans. They count as heavier commercial vehicles and earn about 4,000 euros a year each at a quota price of 300 euros per tonne, against about 800 euros for a van up to 3.5 t. At the price of late 2024, about 80 euros per tonne, the quota of the future fleet falls from about 32,000 to 8,500 euros a year. The mix then takes large e-vans with 56 kWh and a few diesel vans instead of the 4.25 t vans, and the chosen fleet would cost about 23,000 euros more. Without any quota the electric fleet still costs about 9,000 euros a year less than the same fleet in diesel.
Would a larger grid connection allow more electric vehicles?
Not in this example. Spread over the night and smoothed by the depot battery, the depot needs no more than about 60 kW, hall included, of the 200 kVA available. Even with twice the connection, 400 kVA, the plan chooses the same mix. The connection matters when many vehicles fast charge between the waves, with heavier trucks or with a larger fleet. A larger connection would be a separate scenario, not part of this plan.
Where does the future fleet do worse than today?
The depot load peaks at about 55 instead of 21 kW, and the demand charge rises with it. The fleet is smaller, so busy days before Christmas still need rental vans: in the run through all 306 days the future fleet rents a van on 81 days, today’s fleet on 83. Merged tours are longer tours for fewer drivers. The result depends on the assumed driver cost, the quota and the vehicle prices, and other mixes come within about 1 % of the cost of the chosen one.
How long do the vehicles and batteries last?
The model keeps every vehicle for 7 years. In the future fleet a vehicle drives about 35,000 km a year, so about 240,000 km in 7 years. A telematics study of more than 22,700 electric vehicles finds a mean capacity loss of 2.3 % a year, 2.7 % for light vans and 1.5 % for vehicles that charge mostly slowly on AC. After 6 to 8 years of depot charging about 85 to 90 % of the capacity is left. The model therefore plans from the first day with 88 % of the net capacity and keeps a reserve of 10 %, so the tours still fit in the seventh year. A battery warranty of 8 years or 160,000 km is common, but was not checked for these vans; at 35,000 km a year the kilometre limit is reached after about four and a half years, and a battery failure after that is not in the figures. No current residual values for vans were found: the model assumes 12 % of the list price after 7 years for electric and 18 % for diesel.
What does maintenance cost?
Maintenance, repair and tyres are counted per kilometre: 6 cents for a small and 8 cents for a large diesel van, a quarter less for electric vans, 4 cents for a diesel car and 3 cents for an e-car. No source gave cents per kilometre for vans, so these are assumptions. A recent industry report puts the maintenance advantage of electric vehicles at only 15 to 20 %, and after 8 to 10 years repair risks rise (power electronics, battery, 5,000 to 25,000 euros per case). With a 15 % advantage the future fleet would cost about 3,000 euros a year more. Over the year maintenance comes to about 35,000 euros today and 25,000 euros in the future fleet, partly because the future fleet drives fewer kilometres (484,000 instead of 558,000).
Where do the figures come from?
Vehicle data, prices, consumption in summer and winter, battery ageing, the electricity tariff with its demand price, fast charging prices, the diesel price, vehicle tax, the greenhouse gas quota, the licence rule for 4.25 t and the CO₂ factors come from public sources: manufacturers’ catalogues, trade press, laws, the price sheet of a grid operator and the Federal Environment Agency. Where no source was found, the value is an assumption. The depot, customers, tours, direct runs, the year and both fleets are fictional; the roads are real (OpenStreetMap).
More use cases
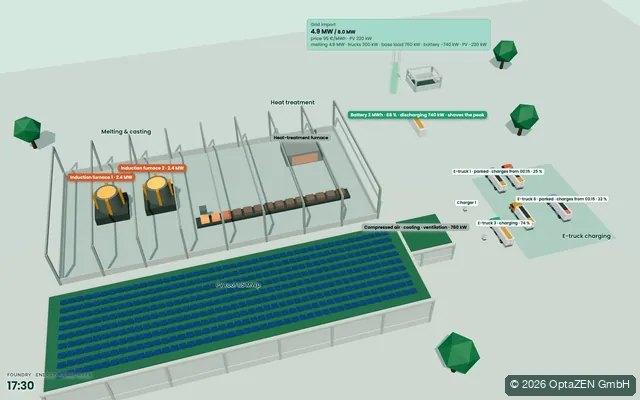
Energy-aware production foundry
Induction furnaces, heat treatment, e-trucks, PV and a battery planned together against day-ahead prices and the 15-minute peak.
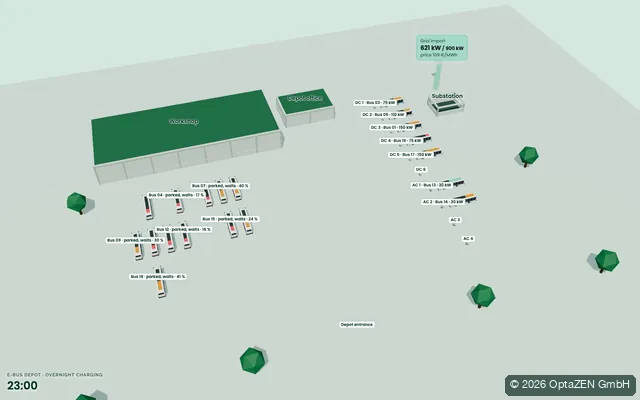
E-bus depot overnight charging
24 e-buses, 10 chargers and a 900 kW grid connection. Every bus is ready for its morning block, charged at night prices.

E-truck charging hub motorway
Long-haul trucks charge in the 45-minute driver break, regional trucks top up between tours. Megawatt and CCS bays share a limited grid connection.
The first step
Where does your planning lose time, capacity or money?
In a free first call we work out which next step is really worth it.