
Battery trains instead of diesel: recharging under the overhead wire, charging islands and battery size in a regional network
Can battery trains run today’s diesel timetable of a regional network on a frost day, where do they need a charging island, how large must the batteries be, and where does each train charge, while running under the wire or standing at a terminus, and for how long?
Result in this example, compared with “Diesel trains today”: km on the battery 84 % instead of 0 %, energy per year (diesel or electricity) 10.1 GWh instead of 26.4 GWh, CO₂ per year 3,472 t instead of 7,009 t.
Rail operators in regional passenger servicesTransport authorities and their tendersRail infrastructure managersVehicle leasing companiesEngineering consultants for electrification
Drag to rotate, right-drag or shift-drag to move the map, scroll or pinch to zoom. On the map, blue sections of the lines have overhead wire, orange sections run on the battery. Each train shows its charge; its label turns green while it charges, standing at an electrified platform, at the charging island or in the depot, and blue while it charges under wire on the move. The charging island and the depot are drawn enlarged and light up when in use. In the schedule, orange is a trip on the battery, blue under wire, green charging. Above the map you switch between the battery trains and today’s diesel trains.
The planning question
Overhead wire on a whole line costs about 1.4 to 3.6 million euros per kilometre of single track. Many regional networks therefore have wire only on their main lines and run diesel trains on the branch lines. Battery trains bridge these gaps: they charge under the wire while running, standing at electrified platforms and junctions, at a charging island and overnight in the depot. Whether this works depends on the battery size and on where and how long each train can charge. This can be planned and simulated.
The railway lines in this example are real; which sections have wire follows OpenStreetMap. Five lines meet at three junctions under wire. One line runs 78 km without wire between two junctions, two branch lines end without wire (35 km and 10 km), a fourth line ends under wire, and a short main line is electrified throughout. The timetable is fictional: every line every hour from 05:00 to midnight, half-hourly in the peaks on two lines, a second unit on the long line in the peaks, 196 trips a day. Today diesel trains run it. The operator, the trains, the candidate sites for charging islands and the depot are fictional. A charging island is a few hundred metres of wire over a platform with its own substation; at most two trains fit under it.
How we plan it
The year is condensed into three days: a mild day at 15 °C, a frost day at minus 8 °C and a hot day at 30 °C. At minus 8 °C a train needs about 2.5 kWh per km from its battery instead of 1.7, and 86 kW for heating when it stands. Gradients count with the potential energy of the train; part of it comes back downhill. Every day is simulated minute by minute: where each train is, how full its battery is, how much it charges under wire, at a platform, at the island or in the depot.
The planning has two levels. The first chooses the islands, the battery size and the fleet. It scores every choice with fast dispatch rules over the three days and adds up the year; to keep reserve for real operation, each day is also run with two patterns of simulated delays. With four candidate sites, three battery sizes and ten fleet sizes there are 2,430 choices; all of them were also scored once, and the chosen one is the best of them. The second level plans each day for the chosen network: which train runs which trip, how far it charges where, and the night at the depot. The two levels are no joint optimum.
The player shows the frost day as timetabled, without delays or failures, so that every charge can be followed. Today’s diesel trains run the same timetable with fixed trains per line.
What the plan shows
| KPI | Optimized plan | Comparison: Diesel trains today |
|---|---|---|
| cost per year | 10,745 k€ −661 | 11,406 k€ |
| investment | 121 M€ +31 | 90 M€ |
| CO₂ per year | 3,472 t −3,537 | 7,009 t |
| energy per year (diesel or electricity) | 10.1 GWh −16.3 | 26.4 GWh |
| lowest charge | 32 % | |
| km on the battery | 84 % +84 | 0 % |
Decisions
- which candidate sites get a charging island (two termini without wire, a crossing station, a middle station) and with which substation power: 1.2 or 2.4 MW
- battery size of the trains (400, 500 or 650 kWh) and the number of trains
- per day: which train runs which trip, also across lines, and the second unit in the peak
- per day: how far each train charges where: under wire while running, standing at an electrified platform or at the island
- per night: charging and preheating at the depot
Constraints
- battery never below 15 %, at least 20 % on arrival at every charging point (reserve for waiting and diversions)
- charging at standstill at most 80 A and 1.2 times the battery capacity per hour; under wire the train charges while running
- at most two trains under an island, within the power of its substation; the pantograph goes up 2 minutes after arrival
- the turnaround times of today’s timetable stay as they are
- every train charged and preheated before its first trip in the morning; the depot connection is limited
Objective
the lowest cost per year: islands and trains over 30 years at 2 %, battery wear, electricity and empty runs; compared with today’s diesel trains on the same timetable (trains, fuel, maintenance) and with CO₂ as a second figure
What the year costs
Costs per year in thousand euros, net, from the mild, the frost and the hot day as timetabled, weighted to a year (245, 75 and 45 days).
| Cost item | Diesel trains today | Battery trains planned |
|---|---|---|
| Trains, 17 in service and 1 reserve (price over 30 years at 2 %, fixed maintenance) | 4,720 | 5,926 |
| Charging island (built cost over 30 years at 2 %, plus 1.4 % operation) | 0 | 235 |
| Diesel (1.0 litre per train-km, 1.60 euros per litre) | 4,313 | 0 |
| Electricity (0.20 euros per kWh) | 0 | 2,019 |
| Vehicle vehicle maintenance per km (wear, workshop, parts) | 2,314 | 1,564 |
| Battery wear per km | 0 | 944 |
| Empty runs | 58 | 58 |
| Total | 11,406 | 10,745 |
Rounded. Vehicle maintenance per km of the diesel trains is 1.48 times that of the battery trains, after a federally funded university study (1.02 against 0.69 euros per km; taken from a summary of the study, the original table is not yet checked); the fixed part per train and year is the same. Access charges and drivers are the same for both and not counted. Investment: about 90 million euros for 18 diesel trains, about 121 million euros for 18 battery trains and the island. Diesel per year: about 2.7 million litres. Electricity per year: about 10,100 MWh.
What pays off over 10, 15, 20 and 30 years
Battery trains cost more at the start (121 instead of 90 million euros for trains and island) and less every year in operation (5.3 instead of 7.4 million euros for energy, vehicle maintenance, battery wear and empty runs). The table adds the investment at the start and the running cost year by year, without interest, in million euros.
| Option | Investment | Running cost per year | 10 years | 15 years | 20 years | 30 years |
|---|---|---|---|---|---|---|
| Diesel trains today | 90 | 7.4 | 164 | 201 | 238 | 312 |
| Battery trains planned | 121 | 5.3 | 174 | 201 | 228 | 281 |
| HVO in the diesel trains | 90 | 7.7 | 167 | 205 | 244 | 321 |
| Hydrogen trains, grey hydrogen | 144 | 8.7 | 231 | 274 | 318 | 404 |
| Hydrogen trains, green hydrogen | 144 | 13.5 | 279 | 347 | 415 | 550 |
| Overhead wire everywhere (rough) | 399 | 8.6 | 485 | 528 | 571 | 657 |
In the base case the extra investment of 31 million euros is earned back after about 15 years, after about 19 years with 2 % interest. After 10 years the battery trains are still about 10 million euros behind the diesel trains, after 20 years about 10 million euros ahead. With the same vehicle maintenance per km it takes about 24 years (33 with interest, longer than the life of the trains). With a CO₂ price of 100 euros per tonne about 13 years (16 with interest), with the federal funding about 9 years (10), with all together about 8 years (9). Trains and island last 30 years in every option, so after 10 or 20 years both fleets still have years left; the battery replacement is part of the running cost per km.
What changes the comparison
Cost per year in million euros, battery trains planned against diesel trains today, with each effect alone and all together.
| Case | Battery trains | Diesel trains | Difference |
|---|---|---|---|
| Same vehicle maintenance per km, CO₂ only as in today’s diesel price, no funding | 10.75 | 10.66 | +1 % |
| Base case: diesel vehicle maintenance per km 1.48 times higher | 10.75 | 11.41 | minus 6 % |
| Base case and CO₂ 100 € per tonne over the life of the trains | 10.75 | 11.69 | minus 8 % |
| Base case and CO₂ 200 € per tonne | 10.75 | 12.41 | minus 13 % |
| Base case and federal funding (40 % of the extra price of the trains, 50 % of the island) | 10.17 | 11.41 | minus 11 % |
| All together: maintenance, CO₂ 100 € per tonne, funding | 10.17 | 11.69 | minus 13 % |
The CO₂ price counts only above the about 60 euros per tonne already in the assumed diesel price of 1.60 euros per litre, so nothing is counted twice. Electricity for the railway is priced in the European emissions trading of power plants and is in the electricity price. Funding is a variant: the federal programme ran from 2021 to 2026, its continuation is open.
Full wire, battery trains, diesel, HVO or hydrogen
A rough comparison per year in million euros on the same timetable and kilometres. Only the battery trains are planned in detail; the other rows are computed as a yearly cost with the same rules (30 years at 2 %, the same maintenance basis).
| Variant | Investment | Per year | CO₂ per year | Cost per tonne CO₂ avoided |
|---|---|---|---|---|
| Diesel trains today | 90 million € | 11.41 | about 8,800 t | |
| Battery trains with one charging island (the plan) | 121 million € | 10.75 | about 3,500 t | saves money (about 125 € per tonne) |
| HVO in today’s diesel trains | 90 million € | 11.72 (11.41 to 12.14) | about 1,300 t | about 40 € (0 to 100) |
| Hydrogen trains, grey hydrogen | 144 million € (19 trains and a filling station) | 15.11 | about 10,700 t | more CO₂ than diesel |
| Hydrogen trains, green hydrogen | 144 million € | 19.96 | about 1,000 t | about 1,100 € |
| Overhead wire on all lines, electric trains | 400 million € (wire 310, 220 to 560, and trains) | about 26 (21 to 41) | about 3,500 t | about 2,800 € |
CO₂ including the supply chain of the fuel: diesel 3.25 kg per litre, HVO from waste oils 85 % less, grey hydrogen 11 kg and green hydrogen 1 kg per kg; the electric variants with the German electricity mix. Wire at 1.4, 2.0 or 3.6 million euros per km, 30 years at 2 % plus 1.4 % operation, electric trains at 5.0 million euros. Hydrogen: 0.36 kg per km, 4.50 (grey) or 9.50 (green) euros per kg at the station, a filling station for 15 million euros, 19 trains of 6.8 million euros for reserve, fuel cell drivetrain maintenance 0.35 euros per km. HVO: 0.05 euros per litre more than diesel (range minus 0.06 to plus 0.20) and 4 % more litres; it is exempt from the national CO₂ price. Rail prices for hydrogen and HVO at the depot are not published; all of them are assumptions.
Questions
Why not put up overhead wire on all lines?
About 155 km of this network have no wire. At 1.4 to 3.6 million euros per km that is about 220 to 560 million euros (about 310 million at a planning value of 2 million per km). Spread over 30 years at 2 % plus operation, that alone is about 13 to 33 million euros a year; with electric trains and energy the network would cost about 21 to 41 million euros a year. The battery trains need one charging island of about 4 million euros and cost about 10.7 million euros a year in all. These are rough values: substations, bridges and tunnels are only in the price per km.
Are the battery trains cheaper than the diesel trains?
In the base case by about 0.66 million euros a year, about 6 %: 10.75 against 11.41 million euros. The battery trains cost more to buy (assumed 6.5 against 5.0 million euros each, 121 against 90 million euros with the island) and the batteries wear (about 0.9 million euros a year). They save the diesel of about 4.3 million euros a year, and their vehicle maintenance per km is lower: a federally funded university study puts it at about two thirds of a diesel train, which here saves about 0.75 million euros a year. If vehicle maintenance per km were the same, both would cost about the same (battery trains about 1 % more). The result also depends on the prices, both assumptions: the battery trains stay cheaper up to an electricity price of about 0.27 euros per kWh (0.20 assumed) or down to a diesel price of about 1.35 euros per litre (1.60 assumed).
Why switch at all?
What the model counts in euros: in the base case the battery trains cost about 6 % less a year, mostly because their maintenance is cheaper. A CO₂ price higher than the about 60 euros per tonne in today’s diesel price would add to that: at 100 euros per tonne over the life of the trains about 0.29 million euros a year, at 200 euros about 1.0 million. The federal programme for alternative drives paid 40 % of the extra price of the trains over diesel and up to 50 % of charging infrastructure; here that would be about 12.8 million euros or 0.57 million euros a year. All together the battery trains cost about 13 % less than the diesel trains. Whether the programme continues after 2026 is open, and the future CO₂ price for rail diesel is not fixed. What the model does not count in euros: many transport authorities now tender networks for battery or electric trains and plan to end diesel operation; battery trains are quieter and emit no exhaust at the platform; electricity can be bought on long contracts, diesel follows the oil price. CO₂ falls by half (about 3,500 against 7,000 t a year).
Why not hydrogen or HVO?
HVO, a renewable diesel from waste fats and used cooking oil, is the cheapest way to cut CO₂ without new vehicles: today’s diesel trains can run on it unchanged. On the same timetable it costs about 0.3 million euros a year more than diesel and cuts CO₂ by about 85 %, about 40 euros per tonne avoided. It keeps the noise, the nitrogen oxides and the maintenance of the diesel engine, and it depends on a limited supply of waste fats that aviation also wants. Hydrogen trains would cost about 15 million euros a year with grey hydrogen, which comes from natural gas and emits more CO₂ than diesel, and about 20 million with green hydrogen. Green hydrogen needs about 20 kWh of electricity per km, five to ten times what a battery train takes from the wire. Fuel cell fleets in regular service have had long periods with many trains out of use, from the fuel cells and from the hydrogen supply; the comparison therefore counts two reserve trains. These rows are computed as a yearly cost on the same timetable, not planned in detail, and the prices for rail hydrogen and HVO at the depot are assumptions.
What does the 80 A rule mean for charging?
Since December 2024 trains on the national rail network may draw at most 80 A from the wire while standing, because measurements found the contact wire too hot above it. At 15 kV that is about 1.2 MW. In this example the battery limits first: a 500 kWh battery is counted with 425 kWh (an average over its life) and takes at most 1.2 times that per hour, about 510 kW or 8.5 kWh per minute. A train needs about 230 to 250 kWh for the 78 km line on a frost day, so a turnaround of 30 minutes at a junction is just enough. Under wire the train charges at up to 600 kW while running, on top of its traction.
How does winter change the plan?
The design day is the frost day at minus 8 °C: the train needs about half as much energy again as at 15 °C, heating takes 86 kW whenever it stands, and every train is preheated for 30 minutes at the depot before its first trip. On this day the lowest charge is 32 %, and the trains stand at a charging point for about 2,300 minutes in all. A 400 kWh battery does not hold the frost day even with three islands; 650 kWh costs about 0.34 million euros a year more. With a colder design day at minus 15 °C the 500 kWh battery still holds, but 650 kWh becomes the cheaper choice by about 0.17 million euros a year.
Why only one charging island?
The long line and two other lines end at junctions under wire, where trains charge in their turnaround. Only the 35 km branch line needs an island at its end; 1.2 MW is enough, because two trains rarely charge there at once. A common rule, an island of 2.4 MW at every terminus without wire, would build a second island at the 10 km branch line, where the wire at the junction already does; it costs about 0.5 million euros a year more. Without the island on the branch line its trains run below 15 % on the frost day.
What about delays and a failed charging island?
The player shows a calm day. Separately, both variants ran through 50 simulated days with random temperatures, delays and, on about one day in seven, a failed charging point for 4 to 14 hours. The battery trains had charging problems on 12 of 50 days (0.8 trips a day held for charging or below a limit), the diesel trains had no charging problems but on 3 days no second unit for a peak trip. When an electrified junction fails for many hours, some battery trains of the long line run too low, because they can then charge only at one end; neither plan has a reserve for this, and real operation would need a fallback such as replacement buses. Delays passed on from trip to trip: 17 minutes a day with the battery trains, 29 with the diesel trains on fixed lines.
Do the diesel trains not have to refuel as well?
Yes, but rarely and not during the day. A common two-car diesel unit carries about 1,600 litres, larger ones up to about 2,800. At about 1 litre per km that lasts for 1,300 to 2,000 km with a reserve. A train here runs about 430 km a day, so it refuels every two to three days, at night at the fuel station of the depot or a stabling yard; pumping takes a few minutes, with moving and coupling about 10 to 20 minutes. No train refuels on the way. Range never limits the diesel trains, so there is nothing to plan for it. A battery train has to recharge several times a day, and that is what this plan is about. Both need 17 trains and one reserve here: the recharging fits into the turnarounds and the runs under the wire. The trips to the fuel station are not modelled; we assume they lie in the night stabling.
Where do the figures come from?
Vehicle data, energy use in summer and winter, charging limits, the 80 A rule, island and catenary costs, vehicle prices, battery wear, maintenance, diesel consumption and the CO₂ factors come from public sources: data sheets of vehicle manufacturers and leasing companies, statements of transport authorities and the infrastructure manager, studies of research institutes and the Federal Environment Agency. Battery capacities of the trains in service are hardly published; 500 kWh is the value of a generic two-car train from a research study. The electricity price of 0.20 euros per kWh and the diesel price of 1.60 euros per litre are assumptions, as are the station elevations and all values of the timetable, the fleet and the depot. The railway lines and which sections have wire come from OpenStreetMap.
More use cases
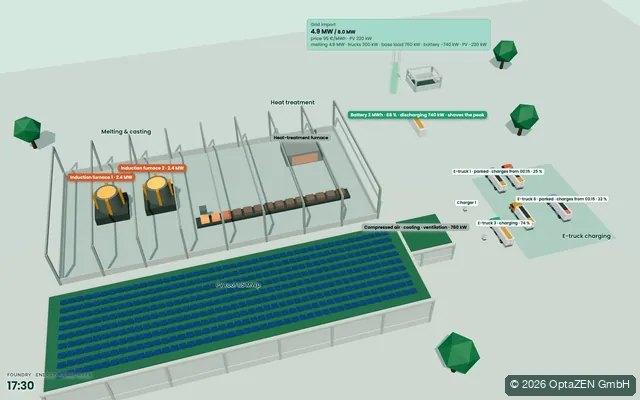
Energy-aware production foundry
Induction furnaces, heat treatment, e-trucks, PV and a battery planned together against day-ahead prices and the 15-minute peak.
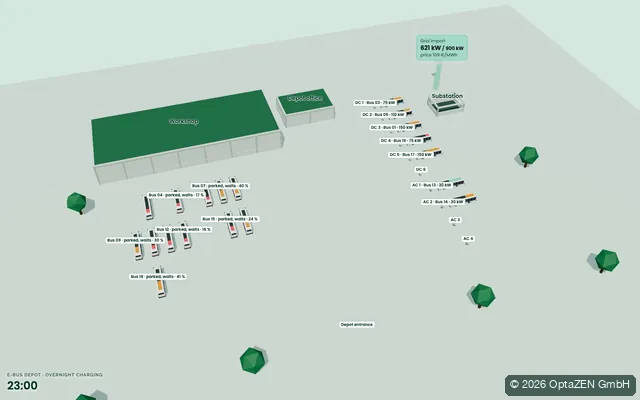
E-bus depot overnight charging
24 e-buses, 10 chargers and a 900 kW grid connection. Every bus is ready for its morning block, charged at night prices.

E-truck charging hub motorway
Long-haul trucks charge in the 45-minute driver break, regional trucks top up between tours. Megawatt and CCS bays share a limited grid connection.
The first step
Where does your planning lose time, capacity or money?
In a free first call we work out which next step is really worth it.