
Project and construction scheduling
Grid build programme: crews, transformers, outages and connection dates
In which week does the grid operator build which measure, with which crew or contractor, with which transformer from the pool and on which outage day, so that the grid stays supplied during the works and new customers get connection dates that hold?
Result in this example, compared with “Release order, district crews”: customers wait on average 10.8 weeks instead of 19 weeks, connection power freed this year 13 MW instead of 11 MW, cable crews busy 93 % instead of 80 %.
Distribution system operatorsMunicipal utilitiesGrid construction companiesCivil works contractors for cable routes
Drag to rotate, right-drag or shift-drag to move the map, scroll or pinch to zoom. The three rings run along the roads; cable works are pale when planned, orange while built and green in service, and a section turns red on its outage day. On top of the schedule: the events and the free capacity per ring and in the substation. Below: connection requests, crews, civil partners, the transformer pool and the outage calendar. Switch to the comparison to see the same year under the usual rules; hover a bar for details.
The planning question
A distribution system operator has about 65 measures to build in one year: old medium-voltage cables, a second 110/20 kV transformer in the primary substation, secondary substations (the small stations that feed a neighbourhood) with 630 instead of 400 kVA, low-voltage reinforcement, house connections for heat pumps and wallboxes, a feeder for a PV park and the links of two charging parks. Three things set this apart from ordinary construction scheduling. The grid has to keep running during the works, so every outage has to fit the state of the ring in that week. Each finished measure frees connection power, so the build plan decides when customers can connect. And transformers are scarce, so who gets the next delivery is a decision about the whole programme. The grid on the real roads is fictional. Three things happen during the year: the 110/20 kV transformer is reported 12 weeks late in week 10, a cable fault binds two crews in week 20, and a second charging park asks for 2 MW in week 26.
How we plan it
The model decides the order of all measures and the way each is built. From this list every measure gets the earliest week in which its transformer has arrived, a crew with the right skill is free, the civil partner has the metres and a safe outage day exists. The outage table is computed ahead for every ring and week. It says for each outage and each pair of outages which stations can be switched over, how many generators are needed and how much PV is curtailed. Here this table is a transparent substitute rule (load against the rating of the feeder head), with no power flow behind it. With a real grid, a power flow would fill the same table.
From the finish weeks follows a capacity timeline: the free power per ring and in the substation, week by week. A connection date is the first week in which the customer’s own measures are done and enough power is free on every part of the grid it needs. Where a customer’s own measures are done before the grid is ready, the plan may offer a flexible connection with the power that is free (§ 17 Abs. 2b EnWG). The PV park takes this: 3 of 8 MW from week 24, full power in week 30, when the delayed transformer is in service.
The comparison lives through the same year under the usual rules: measures in the order of their release, a fixed crew and civil partner per district, transformers first come first served, a second outage on a ring in the same week rejected, and a connection date that is the request plus a standard lead time. In this example the plan connects more customers sooner and has 52 of 64 measures in service at the end of the year instead of 43.
What the plan shows
| KPI | Optimized plan | Comparison: Release order, district crews |
|---|---|---|
| connection power freed this year | 13 MW +2 | 11 MW |
| customers wait on average | 10.8 weeks −8.2 | 19 weeks |
| generators and curtailed PV | 32 k€ +1.4 | 30.6 k€ |
| cable crews busy | 93 % +13 | 80 % |
Decisions
- the order of all measures, and with it the week, the crew and the transformer of each (the order hands out the transformer pool)
- per measure: own cable crew with civil partner A or B, or a turnkey contractor
- the outage day in the week of commissioning
- per connection request: a flexible connection with less power before the reinforcement is done
- after each event: a new plan from the state of that week, started measures stay
Constraints
- outages only in combinations an outage table per ring and week allows: stations are switched over to the other half of the open ring, the rest goes on mobile generators, at most two per ring
- switching operations per day of the control room
- four cable crews by skill, one of them always on standby for faults; one station crew
- civil partners in metres of trench per week, less in frost and wet weeks
- transformers only after delivery
- order of work: medium-voltage renewal of the ring half before the station, station before low voltage, low voltage before house connections
Objective
dates agreed or promised to customers hold; then in euros: waiting connection customers, generators and curtailed PV on outage days, turnkey work, flexible connection set-up and measures left for next year
Questions
What does the plan pay for its result?
It uses about 68 thousand euros of turnkey work on two measures and 6 thousand euros for a flexible connection; the comparison has neither. Generators and curtailed PV cost slightly more than in the comparison (32.0 against 30.6 thousand euros), because the plan builds more measures and does not save on outages here.
Where does the shorter waiting time come from?
Mostly from pooling and from the order. Any crew with the right skill can work anywhere, so crews are busy 93 instead of 80 percent of their available weeks, while in the comparison a district crew waits for work as another district falls behind. Transformers go to the stations where heat pumps are waiting: 13 of 15 heat pump batches are connected this year, against 6. The PV park is connected in week 30 instead of week 52.
Does the outage table change the plan in this example?
Only a little. With 23 outage days on three rings in a year, outages rarely compete: in neither plan does a ring have two outages in one week. The table decides whether a day is safe and what it costs. Its value would show in a denser programme, and that still has to be tested with real grid data.
What happens to the second charging park?
It asks in week 26 and wants to open in week 40. The plan gives it week 11 of the following year, the comparison reaches week 27 of the following year. With the assumed costs, letting it wait is cheaper than a turnkey contractor, and moving other work would break dates already promised. A different cost of waiting would change this answer.
How reliable are the promised dates?
All 18 dates hold in this simulated year, 3 of 18 in the comparison. The two are measured differently: the plan’s dates come from the plan itself, and dates it has given count above all costs when it re-plans. The comparison’s dates come from a standard lead time. Only the three events of this example were tested, with no random delays.
Where do the data come from?
The roads and buildings are real (OpenStreetMap). The grid, the measures, the customers, loads, ratings, durations, rates and costs are assumptions for a plausible example. Lead times follow public statements of manufacturers and trade press: 18 to 36 months for high-voltage transformers, 6 to 12 months for medium-voltage units. In a project, the measures come from the project system, the grid from the GIS and the outage table from a power flow.
More use cases
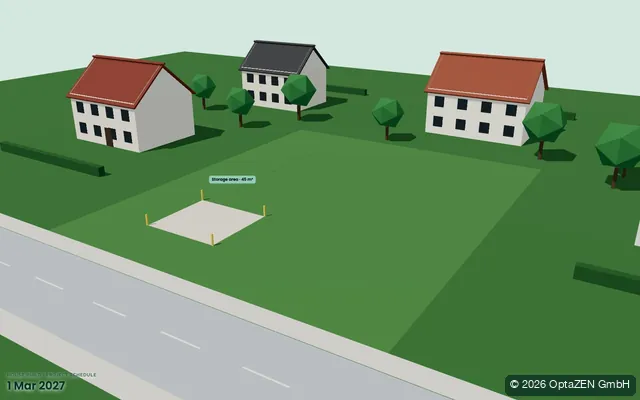
House build project schedule
A detached house with basement, built by 20 trades from 38 candidate companies with their own calendars. 22 deliveries to a small site, crane and scaffold rented by the day.
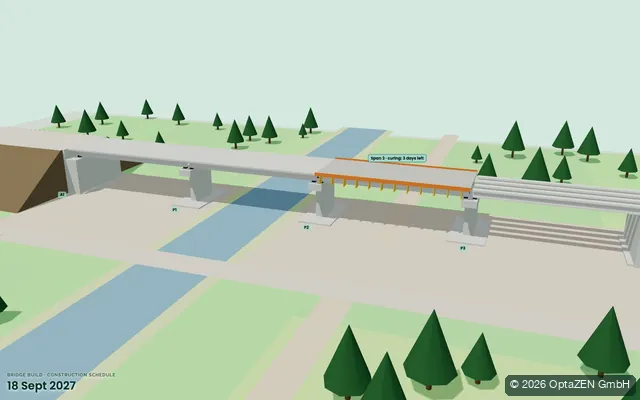
Bridge build construction schedule
A motorway bridge with 4 spans over a river and a farm road. Two crews, one crawler crane and one deck formwork set, with curing times and a weather calendar.
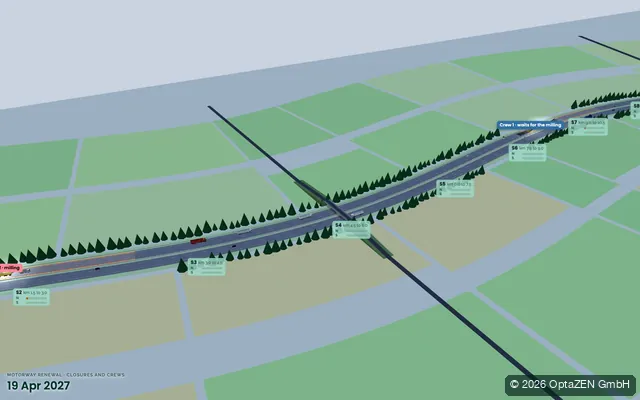
Motorway renewal closures and crews
A 12 km motorway stretch renewed in 16 work zones. Night closures or weekend full closures, 2 milling machines, 2 paver trains and 1 to 5 asphalt crews compared.
The first step
Where does your planning lose time, capacity or money?
In a free first call we work out which next step is really worth it.